HOLC Map and Area Description

Date: 1938
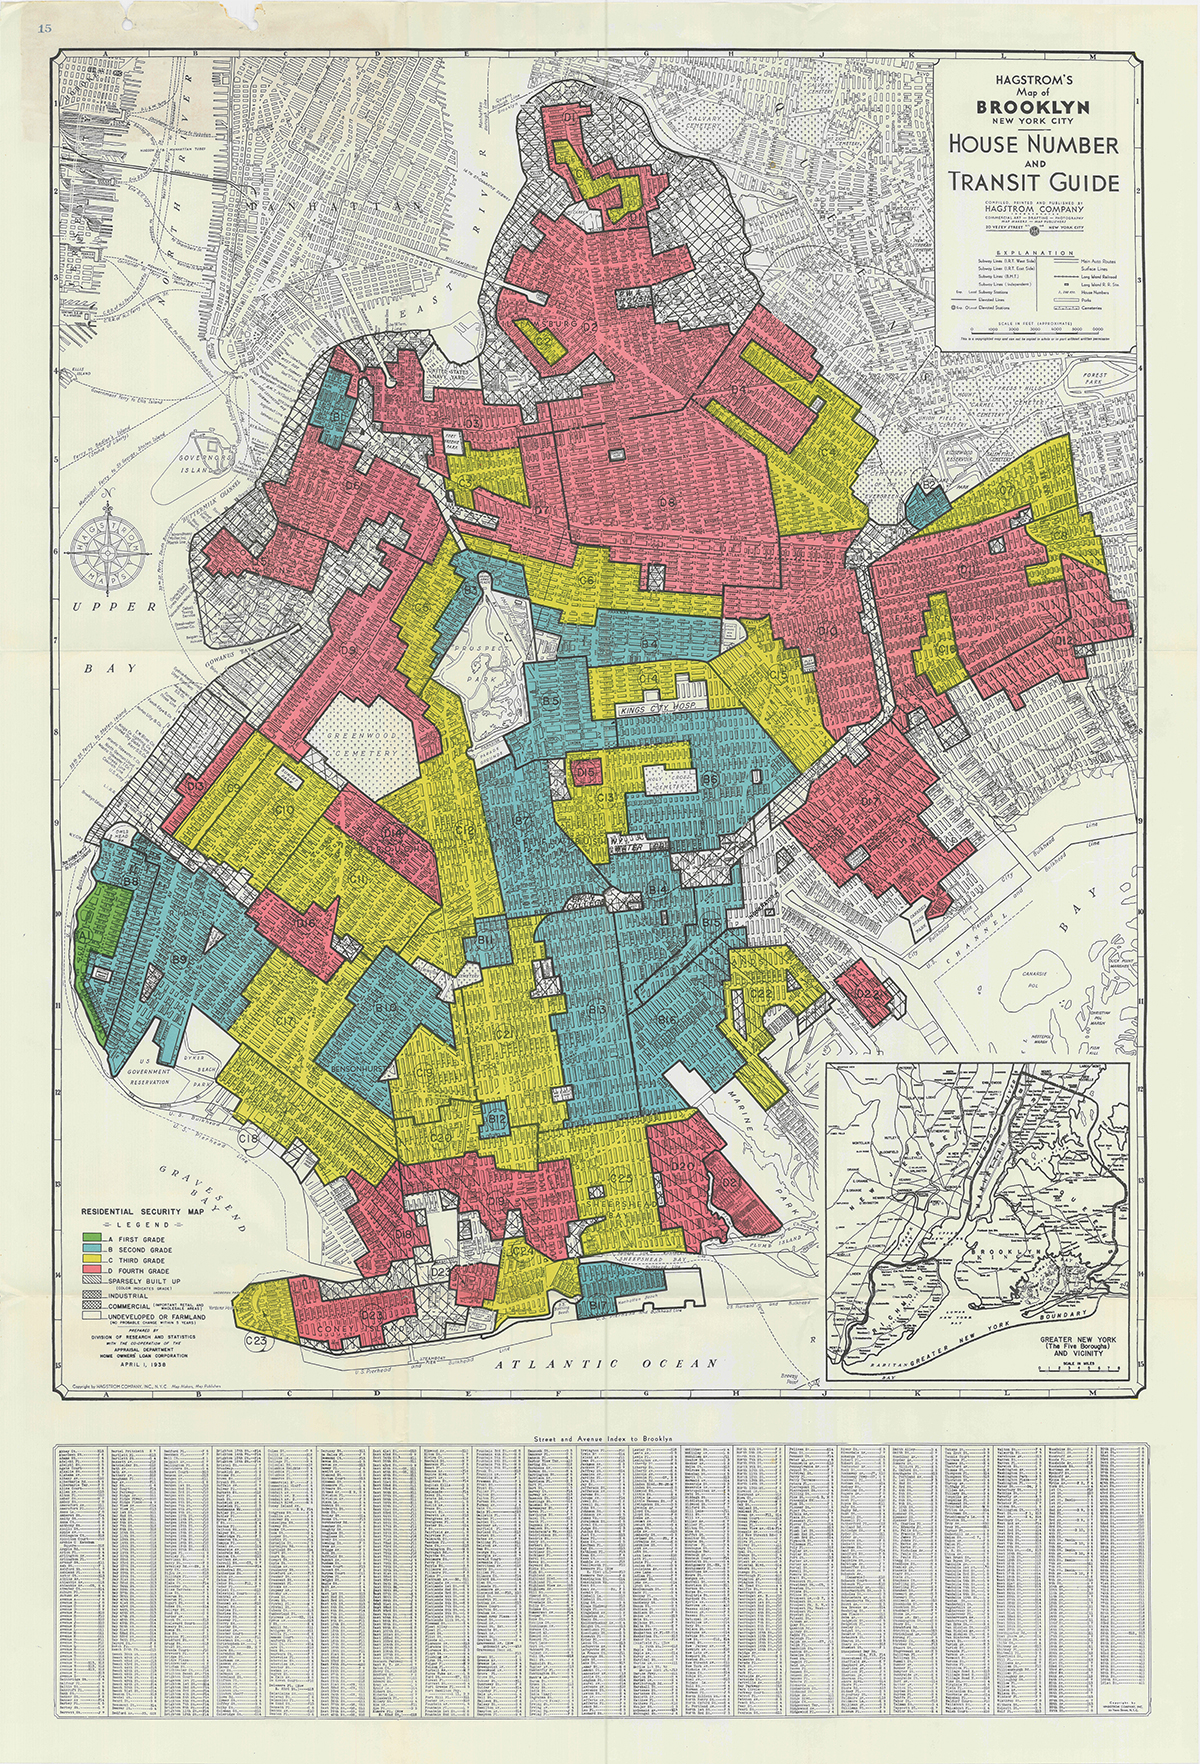
Caption: This map, produced by the federal government’s Home Owners’ Loan Corporation, marked white and middle-class areas of Brooklyn as good investments for home loans, and areas with Black, Jewish, and “foreign” residents as ones that banks should avoid lending to. To zoom in, click here.
In the US election of 1932, voters chose Franklin Delano Roosevelt, a Democrat, as president, and elected overwhelming Democratic majorities in the United States House and Senate. Democrats promised to enact a “New Deal”—a package of social and economic legislation designed to bring the United States out of the Great Depression, which had begun three years earlier.
Through employment and social welfare programs, the New Deal used government resources to help many Americans through this time of crisis in the capitalist economy. But not all were included. The New Deal’s designers, and elected officials who approved the programs, chose to maintain racial inequality and permit segregation. For example, new Social Security programs excluded Black people, because they did not cover domestic or agricultural workers (many of whom were Black).1
Racism shaped the New Deal’s approach to housing as well. The federal government developed the Home Owners’ Loan Corporation to rescue households that were not able to make their home loan payments and risked losing their houses and all of the money they had invested in them.2 The HOLC created new programs for homeowners to receive low interest rates and longer terms for their loans, enabling them to keep their homes.
In the course of this work, the HOLC decided to guide local bankers toward making loans that they thought were more likely to be paid off. HOLC hired local real estate agents and businesspeople to make appraisals of neighborhoods and properties. Local real estate agents, most of whom were white people, used their own criteria to determine what neighborhoods would provide the soundest investments. Using a color coded scheme (Green=“Best,” Blue=“Still Desirable,” Yellow=“Definitely Declining,” and Red=“Hazardous”), private real estate agents determined the value of neighborhoods.
The document above is the HOLC map for Brooklyn, and Coney Island is in the lower left corner of the map.
The HOLC maps guided banks in approving or denying loans to homeowners or prospective buyers in different areas. Each color-coded section on the map had a corresponding “area description” in which local surveyors stated their view of that section. The area description for part of Coney Island, area “D23” shaded red, is included here. Historians debate whether the maps themselves shaped who got loans, or whether they simply reflected existing racist ideas in the housing market.3 The decision to give, or withhold, a home loan (also known as a mortgage), could shape a family’s economic situation, and thus their ability to decide where they would like to live, for generations.
The term “redlining” - which refers to racism in home finance decisions - came from the red-shaded areas marked “hazardous” on these HOLC maps. Local banks avoided or refused to lend to people in “redlined” neighborhoods. This meant that people in these neighborhoods who wanted to stay did not benefit from federal support for their mortgage. White residents might have the option to move to new suburban areas where they could receive a mortgage. Black residents were vulnerable to predatory and unfair home finance arrangements, or were prevented from purchasing a home.4
HOLC maps and guidelines shaped how the massive program of home finance led by the Federal Housing Authority made loans. From 1934 to 1968, more than 98% of FHA loans went to white home purchasers.5
-
Todd M. Michney, “How and Why the Home Owners’ Loan Corporation Made Its Redlining Maps,” accessed May 31, 2024, https://dsl.richmond.edu/panorama/redlining/howandwhy. ↩︎
-
For a summary of this work and how elected representatives from the South and the North sought to maintain their systems of racial discrimination, see Brian Purnell and Jeanne Theoharis, “Introduction,” in The Strange Careers of the Jim Crow North: Segregation and Struggle outside of the South, ed. Brian Purnell and Jeanne Theoharis with Komozi Woodard (New York: New York University Press, 2019), 17-24. See also Ira Katznelson, When Affirmative Action was White (New York: Norton, 2008). ↩︎
-
Richard Rothstein, The Color of Law: A Forgotten History of How Our Government Segregated America (New York: Liveright, 2018), 19 & 63. ↩︎
-
Mark Lopez and Richard Rothstein, Segregation by Design, accessed May 10, 2024,https://www.segregatedbydesign.com/. ↩︎
-
Nikole Hannah-Jones, “Living Apart: How the Government Betrayed a Civil Rights Movement Landmark,” ProPublica, June 25, 2015, https://www.propublica.org/article/living-apart-how-the-government-betrayed-a-landmark-civil-rights-law. ↩︎
Categories: national
Tags: racist segregation, housing
This item is part of "Housing Policies and Patterns" in "How Did New York City Segregate its Schools?"
Item Details
Date: 1938
Creator: Home Owners’ Loan Corporation
Source: Mapping Inequality
Copyright: Government Document
How to cite: “HOLC Map and Area Description,” Home Owners’ Loan Corporation, in New York City Civil Rights History Project, Accessed: [Month Day, Year], https://nyccivilrightshistory.org/gallery/holc-map.
Questions to Consider
- Notice the language on the area description forms. What terms give you a sense of how the HOLC (who made the forms) and local white real estate agents and business people (who filled them out) thought about the communities they were describing?
- What criteria did local real estate agents hired by HOLC use to evaluate neighborhoods?
- Based on the area descriptions, which neighborhood characteristics did HOLC value? What groups of people did HOLC value and devalue?
- Who benefited from these maps and their judgments? How so?
- How did HOLC’s evaluation contribute to segregated housing patterns?
References
How to Print this Page
- Press Ctrl + P or Cmd + P to open the print dialogue window.
- Under settings, choose "display headers and footers" if you want to print page numbers and the web address.
- Embedded PDF files will not print as part of the page. For best printing results, download the PDF and print from Adobe Reader or Preview.
