District 21 Population Maps

Date: 1970
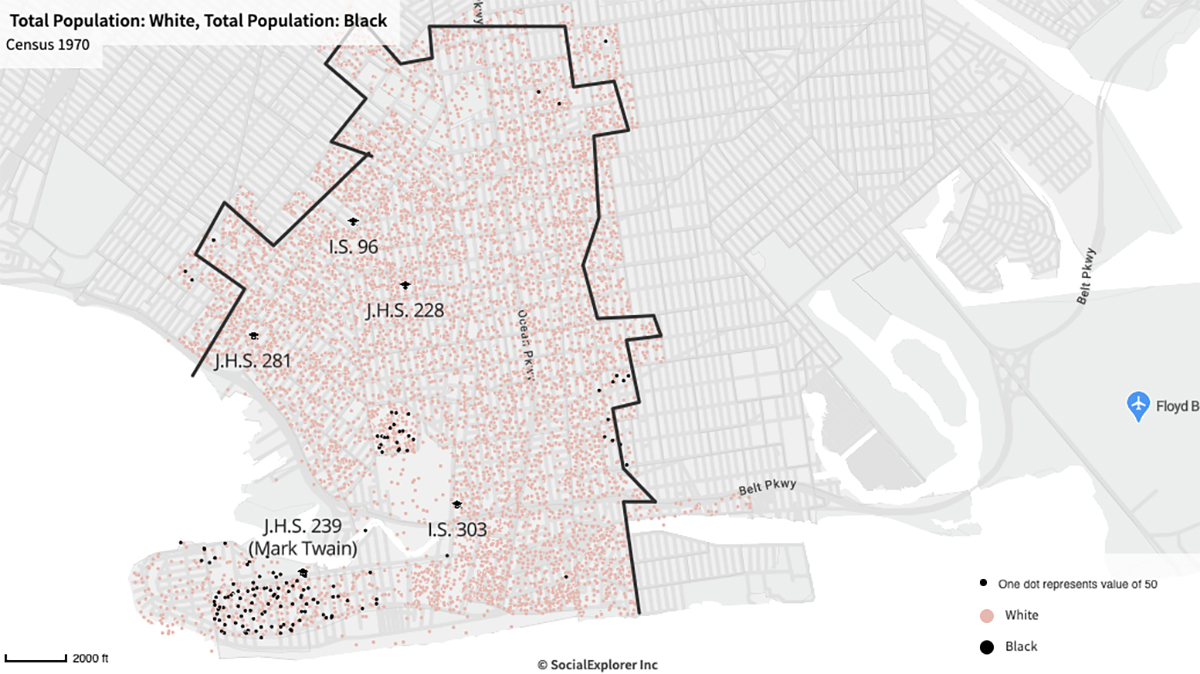
Caption: These maps illustrate the population of Brooklyn’s Community School District 21, which includes the Coney Island and Brighton Beach neighborhoods of Brooklyn, and shows the junior high (or intermediate) schools within the district. The data comes from the 1970 US Census.
This map illustrates the boundaries of Community District 21, which includes the Coney Island, Brighton Beach, and Gravesend neighborhoods of Brooklyn, among others. The map also shows the junior high (or intermediate) schools within the district. Each dot on the map represents 50 people. Using 1970 Census data, the map on the left uses pink dots to represent the reported white population of the area, and the black dots represent the reported “black” population of the area. The map on the right uses red dots to represent the “Spanish Origin or Descent” population. Those identifying on the Census as “Spanish Origin or Descent” may have also identified as “white” or “black” on the Census.
Mark Twain Junior High School (also called JHS 239) sat within District 21 and became the subject of the first school desegregation case in New York City to reach a federal court. Hart v. Community School Board 21 was a class action lawsuit on behalf of Black children attending Mark Twain, which, in 1973, educated a student population that was 81.9 percent “nonwhite,” despite being in a community school district in which the total population was only 30.4 percent “nonwhite.”
Previously, New York City school officials had at times used school zone lines to create segregated school enrollments.
Categories: Brooklyn, K-12 organizing
Tags: racist segregation, zoning and student assignment, housing, court cases
This item is part of "School Zones" in "How Did New York City Segregate its Schools?"
Item Details
Date: 1970
Creator: Matt Kautz
Source: Social Explorer, (based on data from U.S. Census Bureau; accessed July 2022).
Copyright: Public domain
How to cite: “District 21 Population Maps,” Matt Kautz, in New York City Civil Rights History Project, Accessed: [Month Day, Year], https://nyccivilrightshistory.org/gallery/district-21-population-maps.
Questions to Consider
- What do you notice about the district’s student population?
- What do you notice about the placement of schools within District 21?
- If you wanted to make Mark Twain a desegregated school, with an enrollment that aligned more with the population of District 21, how would you draw the zone lines?
- How does a map like this demonstrate that segregation was the result of intentional actions and not a natural occurrence?
References
How to Print this Page
- Press Ctrl + P or Cmd + P to open the print dialogue window.
- Under settings, choose "display headers and footers" if you want to print page numbers and the web address.
- Embedded PDF files will not print as part of the page. For best printing results, download the PDF and print from Adobe Reader or Preview.
